This page focuses mostly on satellite-derived wind data. For ocean conditions, such as marine weather, buoy data and ship reports, visit our Ocean Data page.
Upper Level Winds (including shear and steering currents)
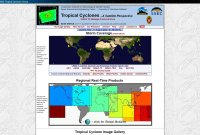
Example of CIMSS' Tropical Cyclone front page
The tropical cyclone page at the Cooperative Institute for Meteorological Satellite Studies (CIMSS) at the University of Wisconsin-Madison has a tremendous amount of data.
Various satellite products are available for active storms, and invests, worldwide. On their front page you can click a storm icon on their map to view data specific to that storm. The second map on their front page has color coded regions. Hover your mouse over a region and options will appear that allow you to choose what product you would like to view. Some of the wind products are listed below.
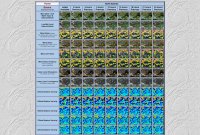
The products below have data every three hours. You can step forward and backward using the "Time Step" option. Most of the products below have a "5-Day Movie" option below the image you are viewing.
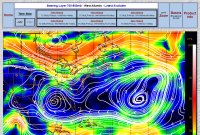
"These wind analyses depict the environmental flow in various oceanic basins for selected tropospheric layer-means." Not sure which to look at? How strong is the storm? At the top of the page you will see "TC MSLP/Vmax" ranges. 700-850mb is generally for weaker (shallow) storms, while 200-700mb is generally for stronger (deep) storms. The link above is for 700-850mb.
This is like the Atlantic page, with some of the same products available that we listed under the Atlantic link. For direct links to the products, you can visit the grid.
The following section contains imagery that has been created using remote sensing instruments on satellites. To learn more about how these satellites orbit, such as what an ascending and descending pass is, you can visit "Satellite Characteristics: Orbits and Swaths" from the Canadian government. For information about how to read a wind barb, such as that "wind barbs point in the direction 'from' which the wind is blowing", click here.
Ocean Surface Winds Team (OSWT) of the Center for Satellite Application and Research (STAR), NOAA/NESDIS
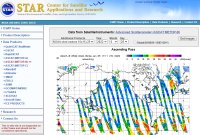
OSWT page to view Metop ASCAT-B imagery
This site contains various surface wind techniques. Take a look at the options in the left column of the page. You'll see some of the following surface wind techniques and measurements under "Data Products".
Make sure you understand how the time is printed on the imagery. The time (in Zulu) at the top is not the time of the data you see in the image. Make sure to read the information at the bottom of the imagery. As of updating this section, for most of the products below, data on the image is sometime from the prior 22 hours from the time at the top. The time, or times, at the bottom of the image, in purple, represent the time a measurement was made in that pass at the latitude given in the text at the bottom of the image.
Metop satellites
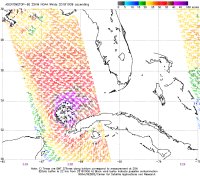
Metop ASCAT-B ascending imagery for October 9th, 2018, around 2:28 GMT, the day before Hurricane Michael made landfall in Florida
"Metop-B (launched on 17 September 2012) and Metop-C (launched 7 November 2018) are in a lower polar orbit, at an altitude of 817 kilometres, to provide more detailed observations of the global atmosphere, oceans and continents." (EUMETSAT) Metop-A, which launched in 2006, was retired in 2021.
Wind speed and wind direction in imagery. You can learn more about the Metop satellites at EUMETSAT (European Organisation for the Exploitation of Meteorological Satellites), a Wikipedia article here or the product description here on NOAA's OSWT site.
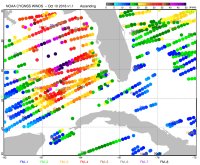
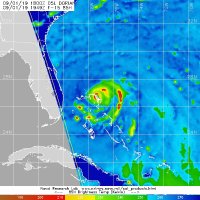
CYGNSS imagery for October 10th, 2018, the day Hurricane Michael made landfall in Florida
Only wind speed is available in imagery. This is a NASA funded mission of "a constellation of eight small satellites carried to low-Earth orbit on a single launch vehicle to make accurate measurements of ocean surface winds in and near the eye of the storm throughout the lifecycle of tropical cyclones, typhoons and hurricanes." (quote from here) You can learn more about CYGNSS in a Wikipedia article here, at NASA or view links to publications and presentations on the product description page here on NOAA's OSWT site.
For CYGNSS imagery the time is handled differently. The time is noted over the data along the pass itself. The color of the time represents which satellite the pass is from. Those colors are along the bottom of the image.
The Koninklijk Nederlands Meteorologisch Instituut (English: Royal Netherlands Meteorological Institute) is the Dutch national weather service. This site has Metop (ASCAT-B and ASCAT-C) data which you can access in the right column. Data is in meters per second (m/s). It also has data from two Chinese satellites, HY-2B and HY-2C.
In the right column under "Near real time Wind Products" they have a lot of products listed. OSI SAF (EUMETSAT Ocean and Sea Ice Satellite Application Facility) has global wind data. EARS (EUMETSAT Advanced Retransmission Service) has regional wind data. EARS has imagery across the Atlantic, including just south of the Equator, as well as most of the Pacific in the Northern Hemisphere, north of around 10N. "KNMI is responsible for the wind products in the context of the EUMETSAT Advanced Retransmission Service (EARS). KNMI deploys a regional-coverage ASCAT wind product with a targeted timeliness of 30 minutes from data acquisition. The winds are also displayed on the web in near-real time. The aim of EARS is to provide polar satellite data from the EUMETSAT MetOp and NOAA satellites with a timeliness suited to the needs of European operational short range regional numerical weather prediction models. The geographical coverage of EARS is primarily over data-sparse sea areas around Europe."
Example of a full resolution OSI SAF ASCAT-C Coastal descending image
Once you click an area you want to view, you can choose whether you want to see the wind displayed as flags (barbs), the default, or arrows by selecting that option in the top right corner. Coastal imagery data has data a little closer to coastlines. With that imagery there is also an option for some places, such as across the Atlantic where tropical cyclones occur, to view even more detailed imagery. You can click the "Show full resolution picture" option, when available, which allows you to see more wind flags, or arrows. You can also simply click the image to see that more detailed imagery, when available. "Note that in the detail pictures, the scatterometer winds are plotted on a cell spacing of 25 km, i.e. only a quarter of the wind vectors is plotted. In some regions however, also a full resolution picture showing all wind vectors is available by clicking on the detail picture."
Screenshot from OSI SAF multi-platform product viewer
While EARS imagery might be best to start with if you know the satellite you want to view data from, there is a viewer that combines the OSI SAF products into a single viewer where once you choose the area you want to view, you can easily toggle between the other OSI SAF products available at that location. Additionally, you can move in other directions by clicking "North", "West", "East" or "South". This viewer makes this the easiest way to navigate through their imagery.
HY-2B: 25km (with full resolution for some areas) | 50km
HY-2C: 25km (with full resolution for some areas) | 50km
"The HSCAT level 1B HDF products used for" these products "are made available by the Chinese National Satellite Ocean Application Service (NSOAS)." You can view information at EUMETSAT about HY-2B and HY-2B.
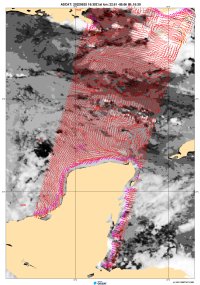
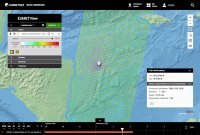
12.5 km ASCAT coastal winds from MetOp-C in Hurriane Eta on November 2nd, 2020 from EUMETSAT's EUMETView service.
You can view 12.5 km ASCAT coastal wind data through their interactive viewer. "Equivalent neutral 10m winds over the global oceans, with specific sampling to provide as many observations as possible near the coasts."
You can click on a wind barb to get detailed information about it, including wind speed, wind direction and the acquisition time. You can use the timeline at the bottom of the viewer to choose another time period. When we reviewed this site in 2022, we could pull up data from 2020.
The default starting view is of Europe. You will need to pan to the area you want to view.
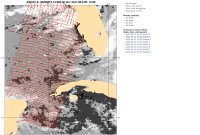
SSM/I 85 GHz channel imagery, with 2 degree ticks, from Hurricane Dorian on September 1st, 2019 from NRL's site (source)
These two sites are very similar. They have a lot of useful content. Note: The second link is safe, but historically you have had to bypass a security warning to view it. Once you select an active storm in the left column, you can look for surface wind imagery available at the top of the page. Because the data is storm specific, you may often see that recent wind data is not available when the satellite sensing surface wind speeds does not pass over the storm. The layout on each site is different. The first link has some wind products in a table at the top of the page. The second link has them in a drop down menu. The most recent imagery will be noted by the color green, followed by yellow and then red, for the oldest.
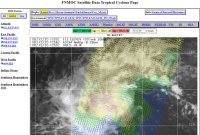
ASCAT MetOp-B 25km surface winds in T.D. Eleven on August 12th, 2020 on FNMOC's site
The first site has a training site here. The second site had a tutorial here, but when we tried the link in 2020 and 2022 it wasn't working. However, the "General" info link was working and contained some additional information. You can click here to load that information onto their front page. You will also find additional satellite products from the first site here.
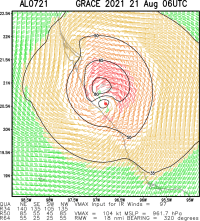
Example of multiplatform satellite surface wind analysis of Hurricane Grace in 2021 from Colorado State University
On NOAA's site this comes from the Satellite Products and Services Division (SPSD).
"MTCSWA combines information from several data sources to create a mid-level wind analysis which is then adjusted to the surface. Eight products are displayed, most notably an inner core scale surface wind analysis." (quote from a page on NOAA's site here)
This analysis is available on both sites above. On both sites you have to select the storm you want to view data for. On Colorado State University's (CSU) site you have to look for "Multiplatform Satellite Surface Wind Analysis" on the storm page that contains a lot of different products. For the first link above to NOAA, that section of their site is dedicated to that analysis. Both sites have data archived.
On CSU's storm pages they also have an option, when available, for "Aircraft-based Tropical Cyclone Surface Wind Analysis". This combines MTCSWA data with aircraft reconnaissance. You can read about that here.
You can view a PDF file here from NOAA that contains information about this product.
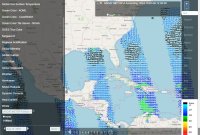
This interactive map allows you to view a wide variety of overlays, including surface wind. In the left column, under "Satellite", select "Winds". (You have to click the actual word "Winds", or the arrow, to show the options) You can choose "Ascending" or "Descending" passes for ASCAT METOP-B. You can also add historical wind data as well, starting from 2020 for METOP-B. METOP-A, a satellite that has been retired, had data there from 2016 to 2021 when we checked in June 2022.
Search for the imagery you want by region, product and sensor. Some of the surface wind imagery you can view is available below. Data from METOP-B and METOP-C is available. The site refers to METOP-B as METOP-1. METOP-B was actually the first unit built, but METOP-A, which is now retired, was actually launched first. (about that)
Archived data is also available. For ASCAT (Metop), the archive for some of those satellites seemed to start in 2018.
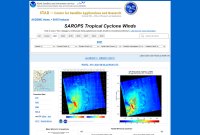
SAROPS stands for Synthetic Aperture Radar Ocean Products System.
This site occasionally has surface wind data for tropical cyclones globally. It may only have an image for a storm every day, every few days or not at all. When available, the site also has a chart which shows the wind speed for each quadrant of the storm and the distance it is from the center.
You can learn more about the data on this site in the publications section of their site.
A note about some of the sites above. Make sure you note the correct time the data was observed. Some times are simply when the image may have been created, such as the last time the system checked to see if info was available.
Note: On November 23rd, 2009 the QuikSCAT satellite stopped providing real time data due to an instrument failure. On August 19th, 2016 the ISS-RapidScat instrument onboard the International Space Station, which was an instrument quickly constructed to replace QuikSCAT, failed and its mission was later ended.
Satellite-Derived Intensity Estimate Techniques
This section has products that estimate surface wind speed using satellite-derived intensity estimates. Rather than our "Surface Wind Imagery" section with imagery that usually has wind barbs, this section generally has data that tries to estimate the maximum surface wind for current tropical cyclones.
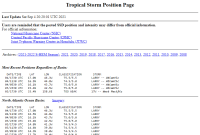
"Subjective position and intensity estimates of tropical disturbances and cyclones across the globe using the internationally recognized Dvorak technique."
NOAA posts Dvorak classifications every 6 hours for tropical cyclones around the globe, including invests. If a system is too weak, or over land, there may be no classification. These classifications are done by a forecaster.
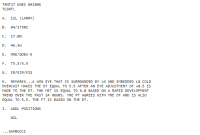
Example of a text bulletin for a storm
The first link above links to a list of the latest Dvorak classifications globally. The text bulletins page above has additional information for each Dvorak classification made for a storm, including remarks from the forecaster about the classification. The other link above is to the NESDIS Tropical Cyclone Products page, which contains a map of where storms are as well as various other products.
Once you have a Current Intensity T-Number, you can get an estimate of the wind speed using the Dvorak Current Intensity Chart. The NHC says this on that page: "Note that these are intensity estimates and may be superceded by reconnaissance and/or surface observations." The Dvorak technique has its limitations. Please keep that in mind when using the chart.
For information on the Dvorak technique, visit the page here, the Wikipedia article here or the PDF file here from Jack Beven of the National Hurricane Center. You can also learn more on the page here, which, like some of the previous links, is also about the Advanced Dvorak Technique (ADT).
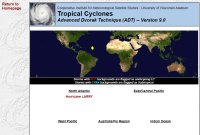
Example of the Advanced Dvorak Technique home page at CIMSS
"The ADT provides an automated, objectively-derived estimate of the tropical cyclone location and intensity using the latest official forecast bulletins from the Joint Typhoon Warning Center (JTWC) and from Regional Specialized Meteorological Centers (RSMC), such as the National Hurricane Center (NHC) and the Central Pacific Hurricane Center (CPHC)." (quote from here)
"The Advanced Dvorak Technique (ADT) utilizes longwave-infrared, temperature measurements from geostationary satellites to estimate tropical cyclone (TC) intensity. The ADT is based upon the operational Dvorak Technique developed by Vern Dvorak of NOAA over 30 years ago." (quote from here)
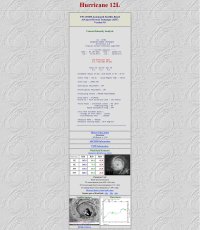
Example of Advanced Dvorak Technique output for Hurricane Larry in 2021 at CIMSS
This technique gives an estimate of the surface wind and pressure of a system. It can help you determine if a storm might be weakening or strengthening. It can also be helpful to find the center of a storm. A satellite image of the storm will show the estimated position. This resource is for developed tropical cyclones only. For invest areas, as well as developed storms, see the section above on the Dvorak classifications that are done by a forecaster. While the Dvorak technique done by a forecaster is done every 6 hours, this automated method is usually done every 30 minutes.
To get the wind speed from a T-Number, see the Dvorak Technique section above for the Dvorak Current Intensity Chart. That section also has links to information about not only the Dvorak technique, but the ADT as well. For a page that it mostly about the ADT, click here for a page from the University of Wisconsin-Madison. It links to some very detailed information on the technique. That page also has an archive of ADT data since 2003. NOAA's site has an archive since 2008.
We link to the real-time ADT estimates from NOAA and the University of Wisconsin-Madison. They may differ since they may use different versions of the ADT and/or estimates might be from different times.
This is another technique that gives intensity estimates for storms. Once you are on a storm page, click "Current Intensity" in the top left corner for text data.
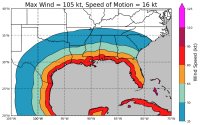
Maximum Envelope of Winds for category 3 hurricane with forward motion of 16 knots making landfall along Gulf Coast
This is an estimate of how far maximum sustained winds might come inland with a landfalling storm. While the research paper describes this model as showing "the maximum possible sustained wind speeds", every storm is different and higher wind speeds, especially in gusts, may be possible than those noted. (as well as in tornadoes) For a specific storm, consult the National Hurricane Center's advisories. You can read about the research paper that these images are based on here.
"The model applies a simple two parameter decay equation to the hurricane wind field at landfall to estimate the maximum sustained surface wind as a storm moves inland. This model can be used for operational forecasting of the maximum winds of landfalling tropical cyclones. It can also be used to estimate the maximum inland penetration of hurricane force winds (or any wind threshold) for a given initial storm intensity and forward storm motion." (quote from National Hurricane Center's site)
You can select from three U.S. regions: Gulf Coast, East Coast and Northeast Coast. You can then select one of the forward motion options for the category of storm you want. Those options for the Gulf Coast and East Coast are 8 knots (9 mph), 12 knots (14 mph), 16 knots (18 mph), 20 knots (23 mph) and 24 knots (28 mph). Those options for the Northeast Coast are 15 knots (17 mph), 25 knots (29 mph) and 35 knots (40 mph). There are color coded wind speeds, in knots, in the imagery that show the maximum sustained winds possible inland. The color coded wind speeds shown inland are in intervals of 15 knots and are 35 knots (40 mph), 50 knots (58 mph), 65 knots (75mph), 80 knots (92 mph), 95 knots (109 mph) and 110 knots (127 mph).
