The satellite-derived intensity estimate techniques that used to be linked from this page are now on our "Wind Data" page.
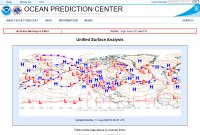
Unified Surface Analysis
Surface analysis includes fronts, highs, lows and other information. You can see tropical waves, tropical cyclones and the Intertropical Convergence Zone (ITCZ). You can learn about the ITCZ here at NOAA or a Wikipedia article here.
The "Unified Surface Analysis" is the combination of surface analysis from the National Hurricane Center (NHC), Weather Prediction Center (WPC), Ocean Prediction Center (OPC) and Honolulu Weather Forecast Office. You can view information about the National Weather Service's (NWS) Unified Surface Analysis by clicking here (PDF) to view a manual on it.
"The Tropical Surface Analysis and NWS Unified Surface Analysis depict the sea level pressure field by showing lines of equal pressure, usually in increments of four millibars (mb) but often in increments of two millibars where the pressure gradient is weaker (especially in the tropics). The analysis also depicts important surface features that affect the weather, including areas of high and low pressure, frontal systems (cold, warm, stationary, and occluded), troughs, tropical cyclones, tropical waves, the Intertropical Convergence Zone (ITCZ), drylines, and squall lines." (quote from NHC page here)
"Beginning 1 June 2011, the Tropical Analysis and Forecast Branch (TAFB) will officially include, as part of its portion of the unified surface analyses (USA), a distinction between the trade wind Intertropical Convergence Zone (hereafter ITCZ) and the monsoon trough ITCZ (hereafter monsoon trough). A second addition to the TAFB portion of the USA will be the depiction of shear lines." You can learn about how these look on the analysis, as well as information about them, in the PDF file here.
A lot of the surface analysis they have focuses on areas north of around 20N. One of the most useful maps on that page for the tropics is the "Atlantic Tropical" map. That includes surface analysis to the Equator. The OPC has a lot of map regions you can choose from and they each include a loop on that page. For that Atlantic map, you can view a 7 day loop here of the surface forecasts issued over the past week. (Pacific: Single image | 7 day loop) You can choose a loop length from one day to fourteen. From any loop you can view all the others by using the drop down menus on the loop page to select which you want to view. You can choose the "Product Category" to toggle between "United Surface Analysis Products", "Atlantic Products" and "Pacific Products". The Atlantic and Pacific categories allow you to view forecasts. We cover that more later on this page where we discuss the "Atlantic Analysis & Graphical Forecasts" page.
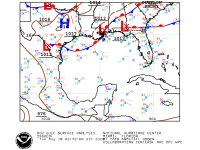
Example of NHC's Gulf of Mexico Surface Analysis
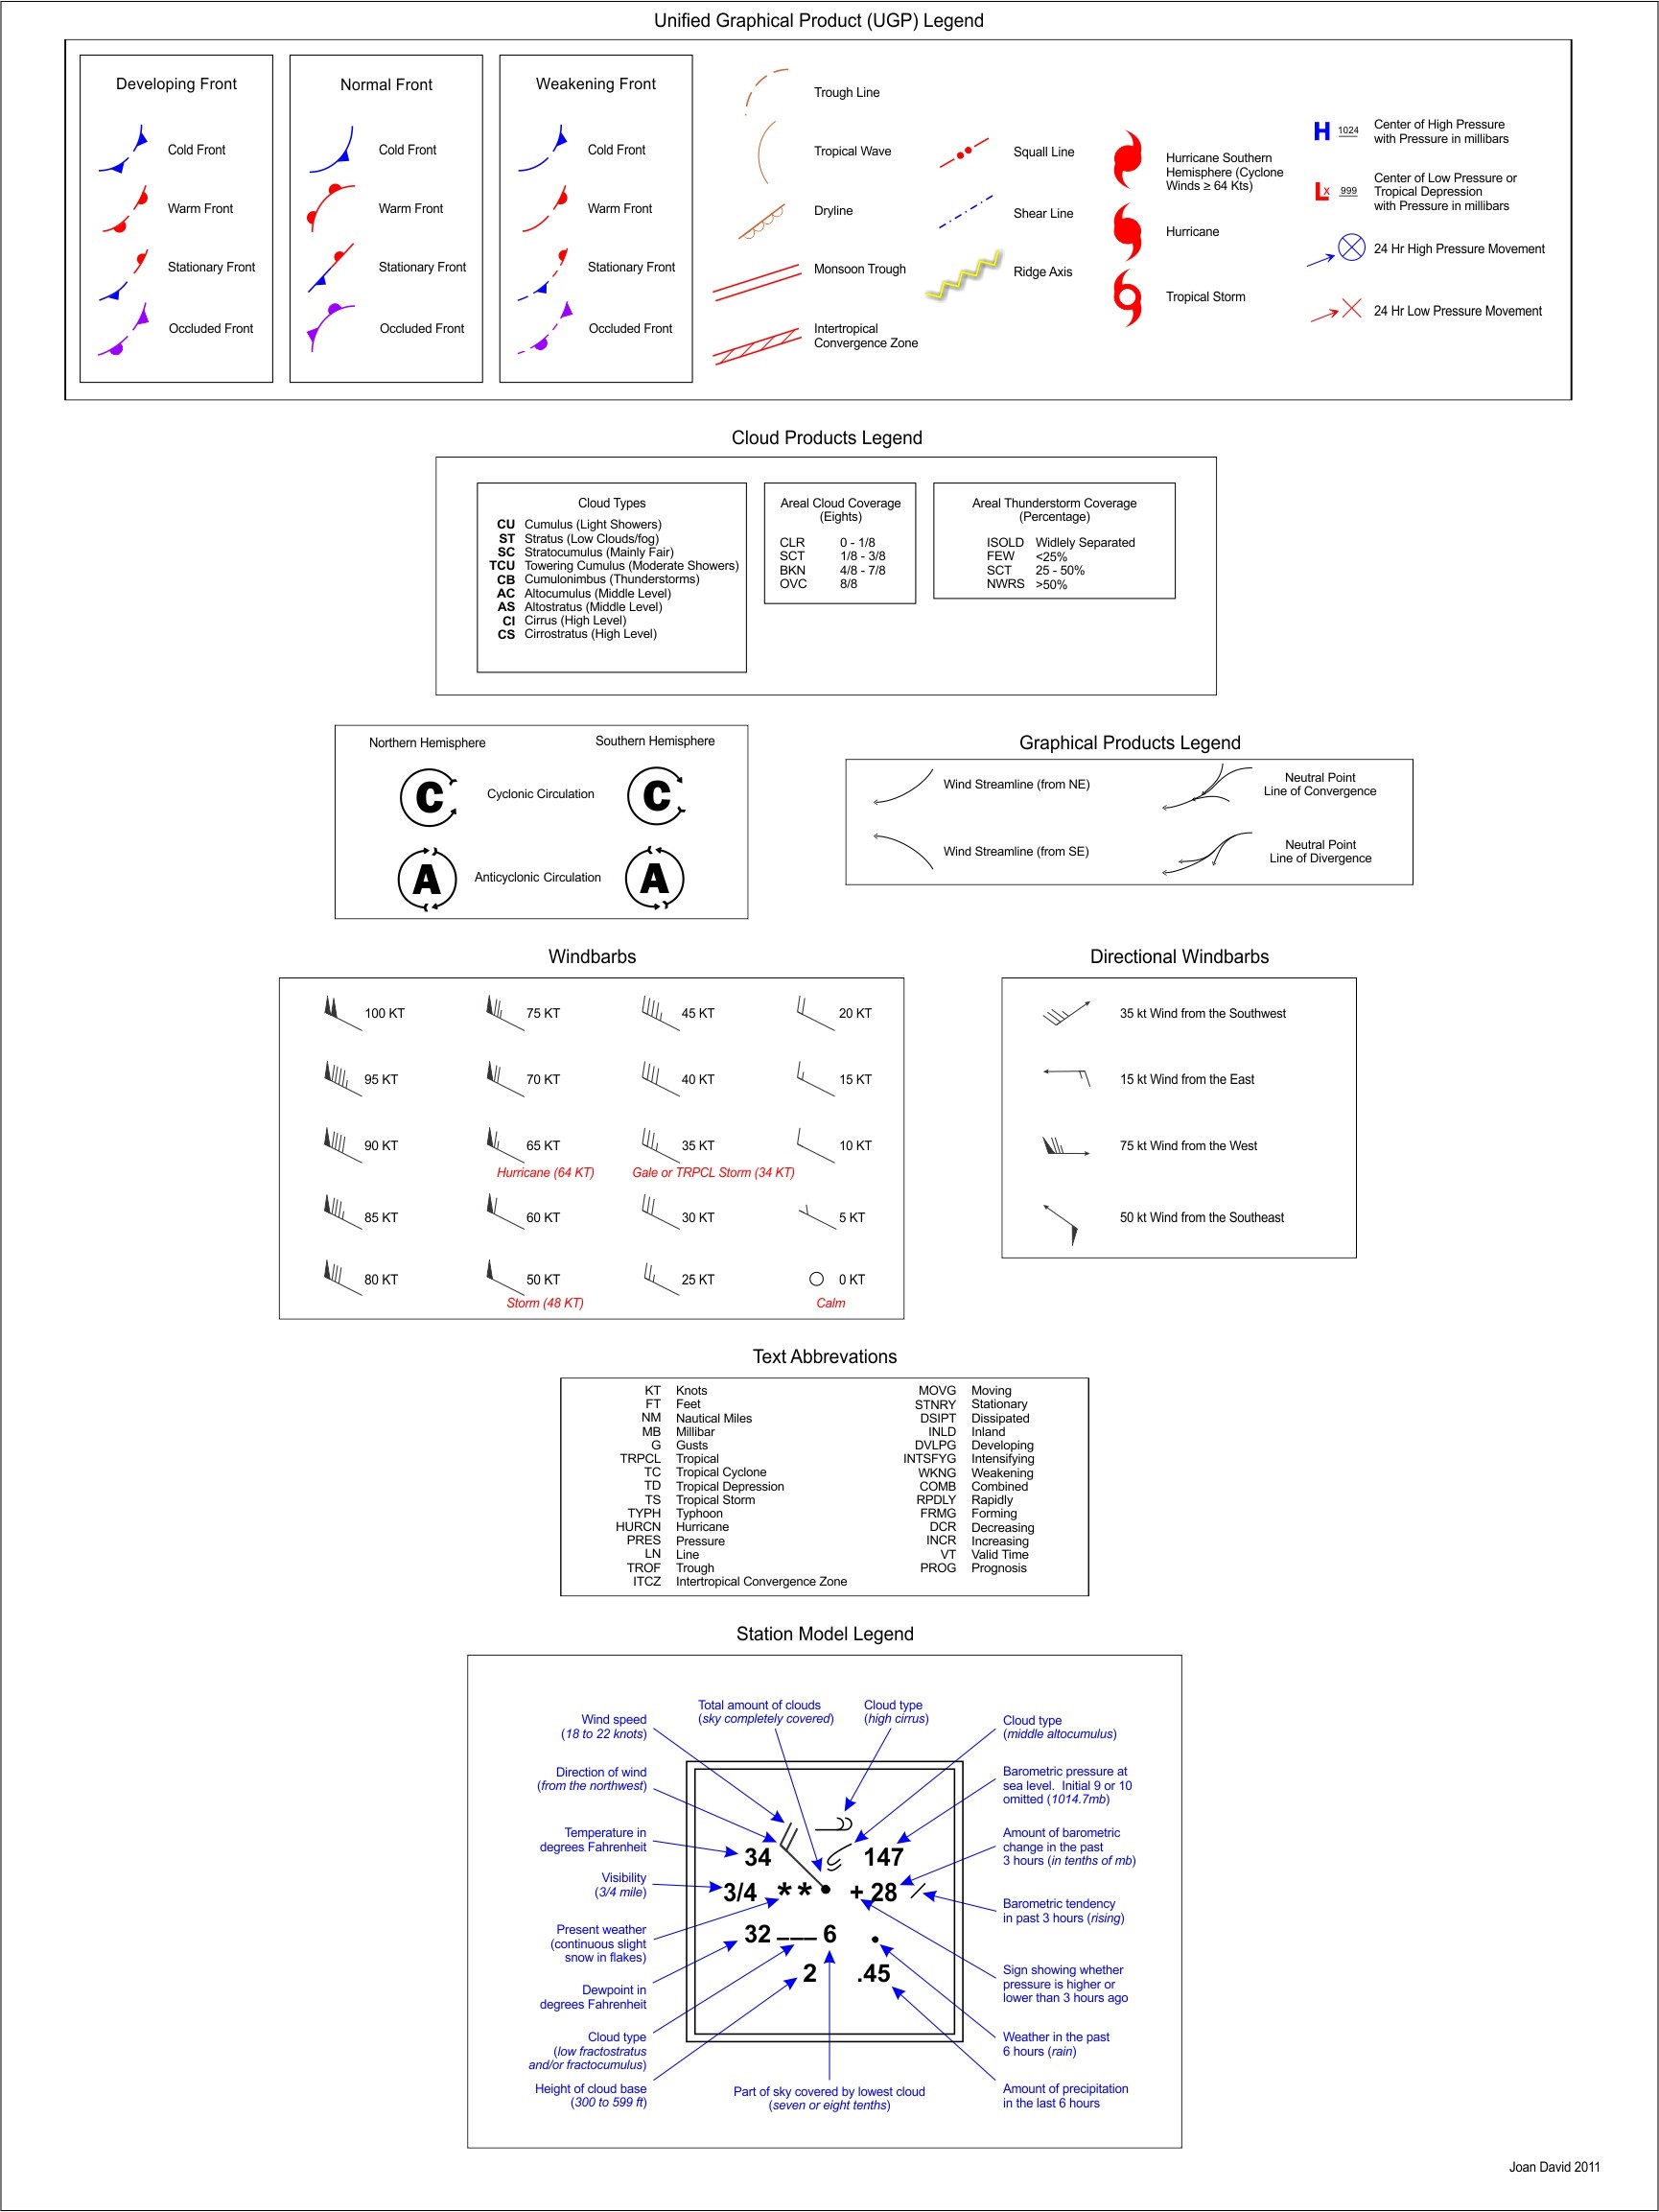
The NHC's Tropical Analysis & Forecast Branch (TAFB) has surface analysis for "the tropics, subtropics, and mid-latitudes". You can view a description of the "Tropical Surface Analysis" product here. To view a legend for their graphical products, which explains what some of the symbols mean, click here. A more in-depth glossary for some things is available here.
Some of the links on their page go to the OPC "Atlantic Tropical" map. They don't offer loops on their page, except for the Atlantic and Pacific ones they link to at the OPC.
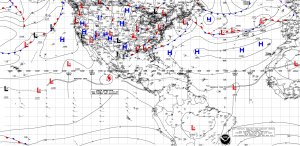
They have a wide area map, of the Atlantic, East Pacific and Central Pacific here. A high resolution PDF version (approximately 3 MB) is here. It contains selectable text data so that the values that can't be read in other imagery can be copied.
Example of WPC's North American Surface Analysis home page
The maps on their site are focused mostly around the Contiguous U.S. If you would like to view surface data for other areas in the Atlantic, see the sites in the sections above.
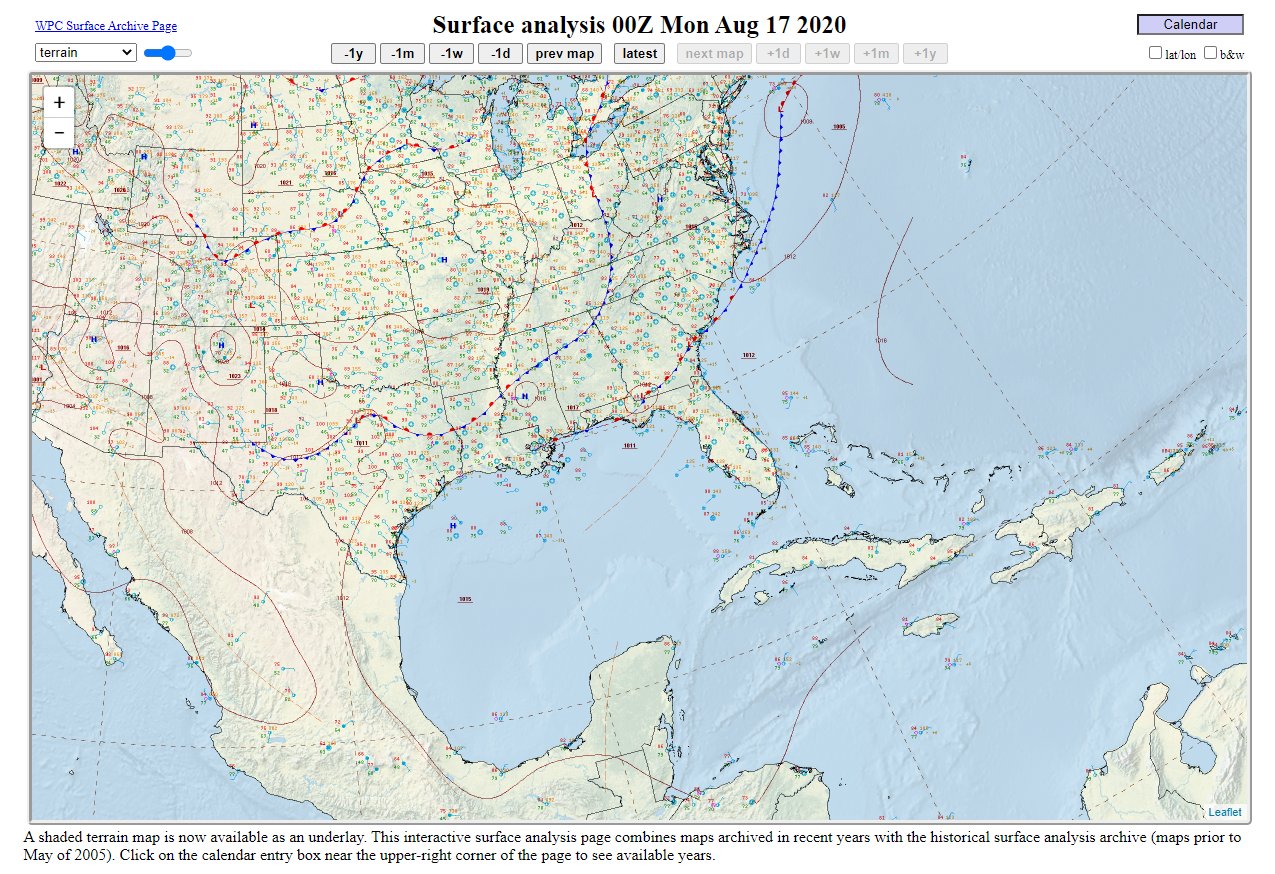
Interactive surface map viewer at WPC
The interactive surface map contains an archive of older surface analysis. In testing this viewer in August 2020, we found some data available back to 1986.
Another viewer like that one, located here, contained data in 1985 as well. The calendar wasn't appearing above the map when we tested this viewer. Additionally, this viewer, which contains archived data only, didn't have data after sometime in 2005. You can view more archived imagery, including simple images, on the page here.
You can view other surface analysis products at the WPC here.
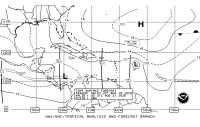
Example of NHC's 72-hour Surface Forecast for the Atlantic
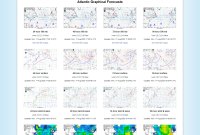
These products are located in the Graphical Products table on the NHC's "Marine Forecasts & Analyses" page. In addition to the NHC's Atlantic Tropical Weather Outlook, their surface forecasts can also show you where tropical cyclones might go that have not yet become depressions. Unlike the outlook however, this would show other surface features as well, through up to 72 hours (3 days).
In addition to the surface analysis at the top of their page, forecasts are also available for 24, 48, 72 and 96 hours. There is also "Wind and Wave Analysis" and "Sea State Analysis". Forecasts include the 500mb level, surface, wind & wave and wave period & direction.
Surface forecasts on this site do not include much of the tropical Atlantic, instead focusing on areas mostly north of around 20N. See the NHC for their surface forecasts which includes forecasts to the Equator.
One of the great features of this site is the loops they have available here.
You can view some of their products in Google Earth here.
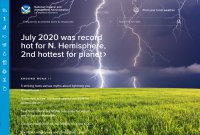
Example of NOAA's home page
Many of the best resources about weather and climate come from NOAA. The front page of NOAA contains the latest news articles from NOAA. We couldn't begin to cover all the other areas of NOAA here.
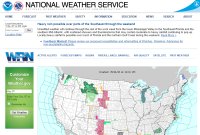
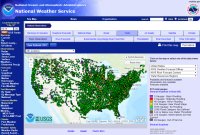
Example of Weather.gov's home page
The front page displays a map of all the current watches, warnings and advisories across the United States. If you click your area on the map, you can visit your local Weather Forecast Office (WFO). You can enter your zip code for current, and forecast, conditions for your area.
To access climate data for a WFO, you can click here to choose an office on a map. To access climate data if you are already on a WFO page, click "Climate and Past Weather". If you want to view today's daily climate report (with such things as the high and low temperature for the day, precipitation for the day, month and year, and normal and record values for temperature and precipitation), or view any record event reports (for temperature or rainfall), you can click the "Observed Weather" tab and then select either of those options.
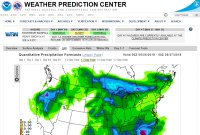
Example of WPC's QPF home page
View images showing the forecast rainfall for the Contiguous United States for the next 1 to 7 days. Their legacy site, which contains additional data, is here.
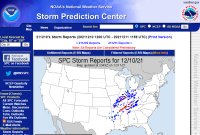
Example from December 10th, 2021 of SPC's Daily Storm Reports page
You can view tornado, wind and hail reports on this page for the United States. For clickable maps, click the "ESRI Maps" link above the static map. To view another product with Local Storm Reports, click here to view a product from NWSChat.
To view "Convective Outlooks" for subsequent days, click here. For each day, you can hover over "Tornado", "Wind" or "Hail" to see outlooks for those kinds of severe weather.
You view the main Storm Prediction Center center page here.
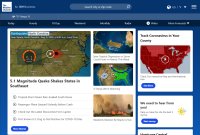
Example of Weather Underground's home page
Their site also has an interactive map, called the WunderMap, which has weather observations, radar, satellite imagery and other features.
They also have historical data for weather stations around the world. They have data from over a quarter of a million weather stations.
Weather Underground is owned by The Weather Company, a unit of IBM, which also owns Weather.com.
Weather Underground doesn't work as well as it used to. In testing their older NEXRAD radar display in June 2022, it hadn't updated since March 2022. For some things, it still remains a reasonable resource. In June 2020 layoffs took place at Weather.com and Weather Underground, though issues with the Weather Underground site started years before that.
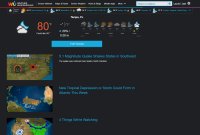
Example of Weather.com's home page
The Weather Company, a unit of IBM, owns Weather.com. Some content on this site also comes from The Weather Channel, which is actually owned by a different company.
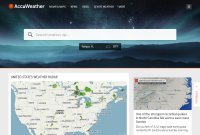
Example of AccuWeather's home page
This site features extended forecasts for locations that go well beyond the 7 to 10 days of most other sites. While you might infer a possible trend in the data, such as above or below average temperatures or an increase or decrease in rainfall, which may or may not be accurate, you should probably avoid using it for any other purpose.
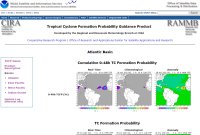
Example of Tropical Cyclone Formation Probability Guidance Product page for Atlantic basin
This product was developed by the Regional and Mesoscale Meteorology Branch (RAMMB) at the Cooperative Institute for Research in the Atmosphere (CIRA).
There are multiple sections on this product page. In the first two sections there is imagery available that shows "Real-Time", "Climatological" and "Anomaly" data. The first part of this graphical product has the tropical cyclone formation probability that a tropical cyclone will form over the next 0 to 24 hours, 24 to 48 hours and 0 to 48 hours. The next section contains the input parameters that were used. There is imagery for the 0 to 24 hour period and then imagery for the 24 to 48 hour period.
"NCEP global forecasts, Reynolds weekly sea surface temperature, and GOES-East, GOES-West, MTSAT-1R and Meteosat-7 channel-3 (water vapor) imagery are used as input to an algorithm to estimate the probability of tropical cyclone formation within 500km of each grid point within the next 48 hours 45 S to 45 N and 0 to 360 E. The product domain is divided into 7 main basins based on satellite coverage and warning agency boundaries." Please note, that since that description was written there are new satellites that it likely gets data from. Himawari-8 provides coverage for the western Pacific. (MTSAT-1R used to provide coverage in that region) Meteosat-9 provides coverage for the Indian Ocean. (Meteosat-7 used to provide coverage in that region)
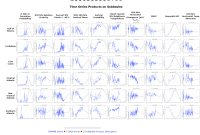
Example of "Time Series Products on Subbasins" for Atlantic
The third section contains a series of charts. For each of the Atlantic subbasins defined in the image on that page there is a series of charts for each of the input parameters that contains data year-to-date. There is also a chart for the formation probability. The current value on the particular chart is represented by a blue line. The climatological value is represented in black.
There are numerous input parameters to look at. For example, you can see how the current analysed shear compares to the average shear this time of year in various regions, either on a map in the second section of the page or on a chart at the end of the page for a particular subbasin in the Atlantic.
"Time series products comparing the current and climatological parameters over the sub-basins are provided on the web site."
This product is available globally. You can access other regions in the left column on the product page.
The Regional and Mesoscale Meteorology Branch (RAMMB) of NOAA/NESDIS and the Cooperative Institute for Research in the Atmosphere (CIRA) have an experimental version of this product. They separate the 0 to 24 hour input parameters and the 24 to 48 hour parameters onto different pages. You can view the experimental version for the Atlantic at those pages. Note: When this experimental version is being updated it is possible that it may not contain valid data at times. If you have any doubt, go with the official version. We noticed an issue in this experimental version in August 2020 when a few of the charts at the bottom of the page didn't closely match data from the operational version. When we contacted them they said they were in the middle of making an adjustment and that it would soon be consistent again. While the operational version uses an older algorithm, it has been vetted.
"The Madden-Julian Oscillation (MJO) is a tropical disturbance that propagates eastward around the global tropics with a cycle on the order of 30-60 days. The MJO has wide ranging impacts on the patterns of tropical and extratropical precipitation, atmospheric circulation, and surface temperature around the global tropics and subtropics. There is evidence that the MJO influences the ENSO cycle. It does not cause El Niño or La Niña, but can contribute to the speed of development and intensity of El Niño and La Niña episodes." (quote from PDF file here)
Under the heading "Expert Discussions", click "MJO Weekly Update (PDF)" for an expert discussion.
You can view an article here from Climate.gov that is titled "What is the MJO, and why do we care?". You can view a Wikipedia article here on it.
If you know what the Current Intensity (CI) number is for a storm, or its surface pressure, you can get an estimate of what the wind speed might be using this table. The NHC says this on that page: "Note that these are intensity estimates and may be superceded by reconnaissance and/or surface observations." The Dvorak technique has its limitations. Please keep that in mind when using the chart. For more on the Dvorak technique, and to see satellite intensity estimates for tropical cyclones using this technique, and others, click here to visit our "Wind Data" page.
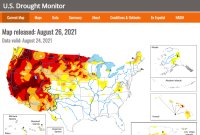
Example of the front page of the U.S. Drought Monitor
This site has weekly images showing current drought conditions across the United States. You can view a map by region, and even by state. A chart will approximate the percent of the selected area in each category of drought. Below the map, they also have an overall drought summary that also includes summaries for each region.
"The U.S. Drought Monitor is produced through a partnership between the National Drought Mitigation Center at the University of Nebraska-Lincoln, the United States Department of Agriculture, and the National Oceanic and Atmospheric Administration."
This site details what NOAA expects of the hurricane season. It is important to note that "This outlook is a general guide to the expected overall activity during the hurricane season. It is not a seasonal hurricane landfall forecast, and it does not predict levels of activity for any particular location."
Whether a season is forecast to be above, near or below average, it only takes one storm to potentially change your life. If a season is below average, that doesn't matter if you were one of the people impacted by a storm in that season. You should always prepare for each season regardless of what seasonal forecasts say.
About: "This FAQ (Frequently Asked Questions) answers various questions regarding hurricanes, typhoons and tropical cyclones that have been posed to hurricane researchers over the years. While it is not intended to be a technical guide, references are given throughout the FAQ for those that would like additional, detailed information."
This glossary about hurricanes is more simplistic than the other glossaries listed in this section. It has over 50 terms. You can view the NHC's Frequently Asked Questions (FAQ) here.
"This glossary contains information on more than 2000 terms, phrases and abbreviations used by the NWS. Many of these terms and abbreviations are used by NWS forecasters to communicate between each other and have been in use for many years and before many NWS products were directly available to the public. It is the purpose of this glossary to aid the general public in better understanding NWS products."
This glossary has over 12,000 terms. "The Glossary of Meteorology purports to define every important meteorological term likely to be found in the literature today. It attempts to present definitions that are understandable to the generalist and yet palatable to the specialist; and it intends to be a reference book that satisfies its user in a minimum of his time. Finally the Glossary provides an excellent opportunity to collect and define terms that are either obscure or very local in nature."
One of the best resources for finding information about past hurricanes, and their impacts, is Wikipedia. You can verify the information it contains by looking at the references listed. There is likely no better site for viewing all of this data in one place. Select a year to view information about storms from that year.
For this year's Atlantic hurricane season, click here.
This site has a city database that has information about storms that have impacted those cities. Also be sure to check out the message board, CaneTalk, which the owner of Tropical Atlantic helps to administer.